


Case study · Personal build
LiveInvestment Strategy Engine
A rules-based engine that scores the market daily and flags when the strategy says move.
- Next.js
- FastAPI
- Python
- Vercel
- Supabase Postgres
- Claude API
- 22
- Golden tests
- 3
- Report cadences
- 6 tabs
- History migrated
- 0%
- Math by LLM
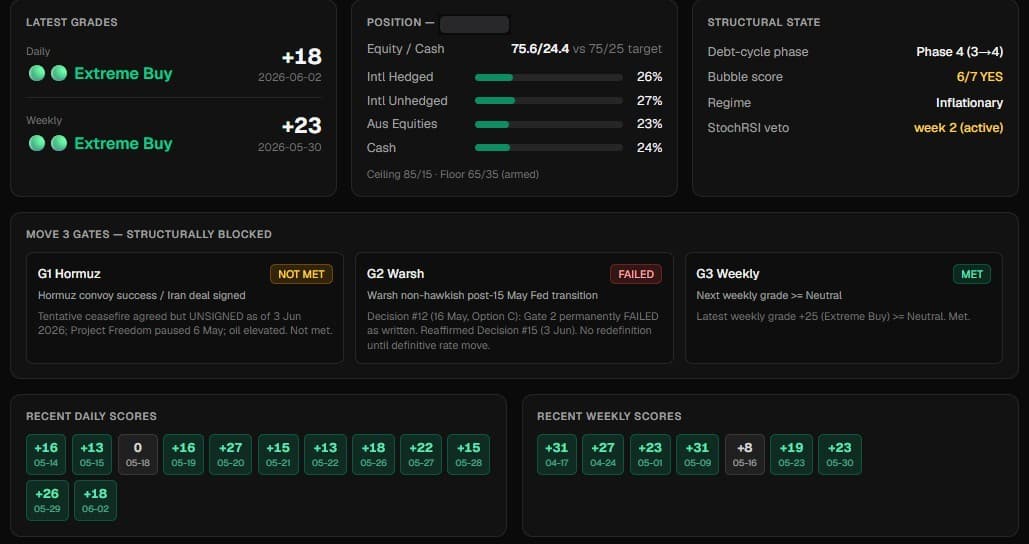
I run a disciplined, rules-based strategy for my retirement fund (superannuation). For a while I operated it by hand — a long ChatGPT prompt to read the market, then an Excel sheet to track it. It was slow, easy to get wrong, and impossible to audit. This replaced that with one system: it pulls live market and macro data, scores conditions against a fixed debt-cycle rulebook, tracks where my allocation can and can't move, and writes me a daily, weekly and monthly report — all on a live dashboard. It also tracks whether the strategy is actually working: balance over time, returns, and where each sleeve sits. It recommends; I decide. It never moves money on its own.
Inside the app
The problem
The strategy itself is sound — a rulebook for reading the debt cycle and deciding when a defensive or offensive move is justified. The problem was operating it. Doing the maths by hand (or worse, asking a language model to read a moving average off a web search) is exactly where it broke: the old workflow produced around six moving-average errors in a single month. When the numbers driving a real financial decision are wrong, the whole thing is worse than useless.
So the goal was a system where the maths is never in question, the rulebook can't quietly drift, and every report is reproducible — while still using AI for the parts it genuinely helps with: reading the news and explaining the data in plain language.
Under the hood
How it's actually built. The plain version is above — everything from here down is the technical detail, for anyone who wants to see how the pieces fit.
What it actually does
Two layers, kept deliberately apart. A deterministic engine owns every number a decision depends on; a narrow LLM layer handles only the language around those numbers. Reports run on three cadences — daily, weekly and monthly.
The deterministic engine
- Indicatorsmoving averages, RSI, StochRSI — computed in plain Python from stored price history, not read off a web search
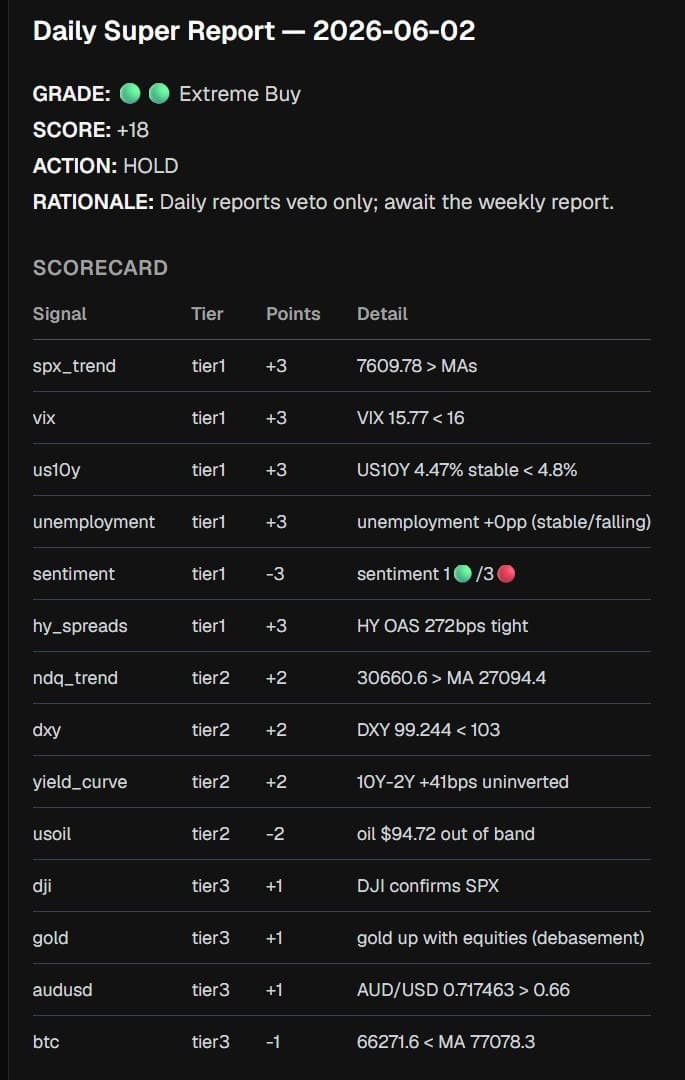
- Scoringdaily (tiers 3/2/1) and weekly (4/2/1) scores with exact grade bands, straight from the rulebook
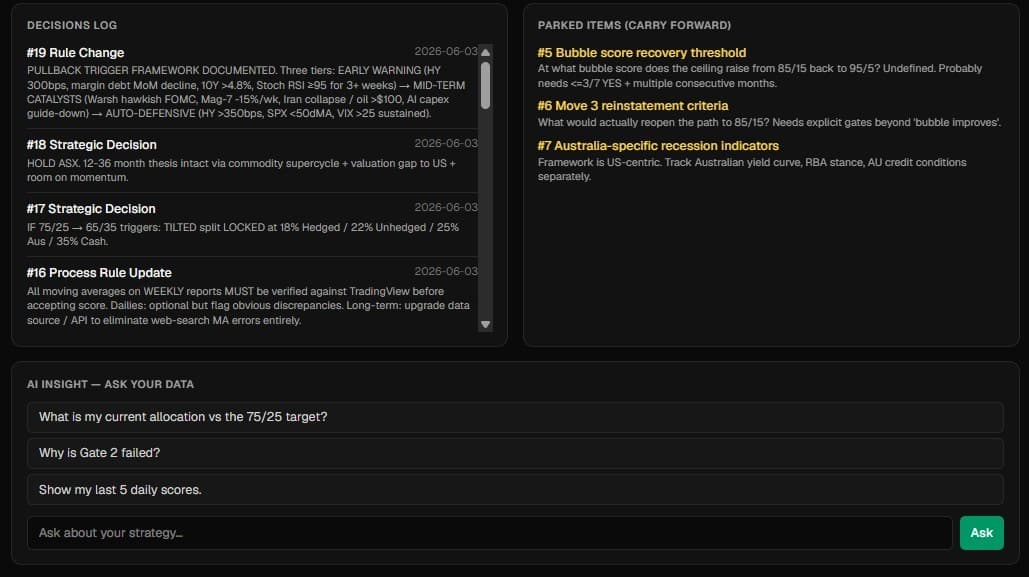
- Gatesmove-eligibility gates that can only change with cited evidence — no silent drift
- Triggers & vetoesauto-defensive triggers (HY-spread, 50dMA, VIX) and slow vetoes (RSI, StochRSI, bubble score, debt-cycle phase)
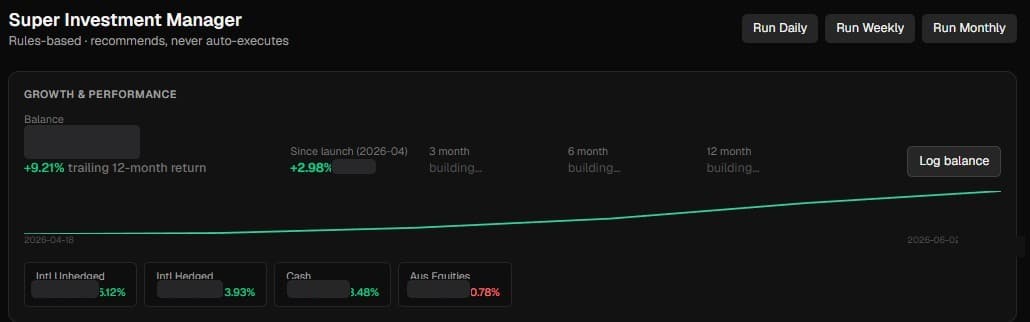
- Growth & performancebalance over time, since-launch and trailing returns, per-sleeve — and periods read “building…” until real history backs them, never a fabricated number
The LLM layer (narrow)
- News sentimentclassifies the macro/credit news that frames a report
- Report narrativewrites the daily/weekly/monthly write-up around the fixed numbers
- Insight chatanswers plain-English questions over your own strategy data
The five decisions worth talking about
The interesting work wasn't the dashboard — it was deciding what code owns versus what the model owns, and making the whole thing reproducible. Five decisions carried most of the weight.
The reliability boundary — maths is never left to a model
The moment any step is only 90% reliable, a five-step pipeline is already a coin-flip. So nothing the decision depends on is computed by an AI — it's plain, testable code.
If each step in a pipeline is ~90% accurate you're at roughly 59% after five steps. That maths is why the boundary exists: indicators, scores, gates, vetoes and triggers are all deterministic Python computed from stored price history, never values an LLM read off the web. The legacy ChatGPT-and-Excel flow made ~6 moving-average errors in one month; the engine makes zero, because it's arithmetic, not inference. The model is used around the fixed numbers — sentiment, narrative, chat — and never to produce one.
The rulebook is data, not code
The whole strategy — every threshold, band and weight — lives in one config file. Changing the strategy means editing data, and every report can be reproduced exactly.
Thresholds, grade bands and weights live in a versioned config/framework.toml — the rulebook as data. Move-eligibility gates can only change with cited evidence, which kills “gate drift” (the strategy quietly loosening over time). Because the rules are data and the engine is pure, it's fully testable: 22 golden tests reproduce the example reports exactly (a daily of +18 and a weekly of +25), stdlib-only, so a refactor that changes a single number fails loudly.
One engine, two homes — live in the cloud, identical code on my machine
It's deployed and always-on: the dashboard and reports run in the cloud on a schedule, so they arrive even when my PC is off. The exact same code runs locally on my own machine for development — nothing forks.
It runs live on Vercel — the Next.js dashboard and a FastAPI backend as two projects, against Supabase Postgres (Sydney), with a .github/workflows/report.ymlcron generating the daily/weekly/monthly reports straight into the cloud database. Locally it's the identical engine on SQLite plus scheduled CLI runs (Windows Task Scheduler: weekday dailies, a Monday weekly, a monthly on the 2nd, all AWST). The trick is one line: tools/db.py picks the backend on the presence of a DATABASE_URL — Postgres in production, SQLite in dev — and the same SQL runs against both. Price data is keyless and FRED is free, so the only secrets are the API keys held as repo/Vercel secrets, and a push to mainauto-deploys both projects. The engine doesn't know or care which environment it's in.
Migrating six tabs of history into a typed backbone
The strategy already had months of hand-kept history in a spreadsheet. All of it had to come across cleanly, because the engine reads from that history.
A six-tab Excel tracker was migrated into a typed SQLite schema as the system's backbone — 29 daily entries, 7 weeklies, 19 logged decisions, plus gate states and parked items. The indicators compute off that stored history rather than re-fetching, which is both faster and the reason the golden tests can be exact: given the same rows in, the engine must produce the same report out.
Closing the loop — and refusing to fabricate a number
Signals are only half of it; the real question is whether the strategy is working. So it now tracks the money — but only ever shows a figure it can actually back with data.
A new growth & performancelayer tracks balance over time, since-launch and trailing returns, and each sleeve's return — computed from logged snapshots, anchored to the latest snapshot rather than the wall clock so the numbers stay consistent with the data. The detail that matters: a 3/6/12-month delta resolves to the nearest snapshot at or beforethe cutoff, and if the logged history doesn't reach back that far yet, the period returns null and the dashboard reads “building…” — never a guessed or interpolated figure. The same reliability boundary as the rest of the engine, applied to performance: show the real number or show nothing. (Reports also moved to proper markdown rendering, so the daily/weekly/monthly write-ups are readable, with a full scorecard.)
Why it's built this way
The throughline is the same one the rest of this portfolio is about — probabilistic where it should be, deterministic where it must be. The model reads news and writes prose; code owns anything where being slightly wrong isn't acceptable — the indicators, the score, the gates, the money decision.
That boundary isn't a limitation, it's the product. It's what makes a system you can actually trust with a real financial strategy, and it's the cleanest example I have of the kind of architecture I want to build.
Where it is now
It's deployed and live— running always-on in the cloud (Vercel for the dashboard and API, Supabase Postgres for state), with a GitHub Actions cron generating the daily, weekly and monthly reports on schedule and keeping the dashboard current whether my machine is on or not. Because it's a personal project operating on real financial data, the dashboard sits behind a password and stays private. It is notfinancial advice — it's a systematic decision-support tool that operates a predefined rulebook and hands the call back to a human.
Want the full walkthrough?
It's a private app on my own financial data — but I'll happily walk you through the architecture and the deterministic/AI boundary live.